Pedestrians Rhythms By Neigborhood

Eric Busboom.

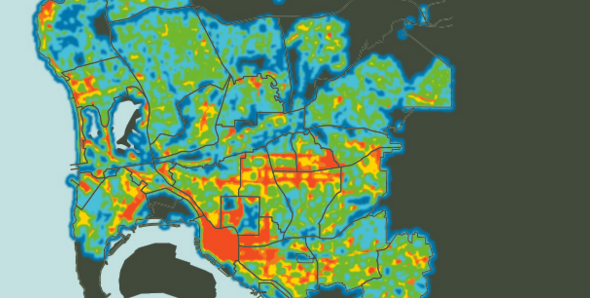
San Diego’s CityIQ system consists of about 4,400 smart street lamps, which use a variety of sensors to track parking, pedestrians, traffic and a variety of environmental conditions. This analysis reveals pedestrian paterns using time-oriented heatmaps.

`` Full notebook on github

This dataset aggregates the number of pedestrians, traveling in either direction, into 15 minute intervals, per walkway, and links the walkways to communities. Then, data is vizualized by community in a heat map with two time dimensions, known as a rhythm map. Since this data is only available for the prior 6 months, we can’t analyze long term patterns, so we only present a few types of maps, including traffic for hour of day versus day of week and for hour of day versus week of year.

Continue Reading →

Crime Rhythm Maps

Eric Busboom.

Exploring crime patterns with Ryhthm Maps, heat maps with two time dimensions.

`` Full notebook on github

A Rhythm map is a heat map with two time dimensions, which makes it much esier to find temporal patterns in some kinds of data. This example will use crime incidents from San Diego county, from 2007 to 2013..

Plotting the number of incidents for burglary versus the hour of the day, for instance, results in this dull chart:

Continue Reading →

Plotting San Diego Streetlights

Illustration by Amy Krone using data supplied by Civic Knowledge

 The Challenge

After writing a series of stories about San Diego city infrastructure, Voice of San Diego reporter Liam Dillon turned his attention to street lamps. Although the city published GIS data for the locations of street lamps, Liam wanted to understand how the number of lamps varied by community.

The Solution

Working through our non profit project, the San Diego Regional Data Library, we computed small-area areal densities of street lamps and aggregated the densities by San Diego community, allowing Liam to tell a compelling story about where San Diegans are in the dark

Continue Reading →

Health Data +

The Challenge

As part of it’s “Free The Data” program, the California Health Care Foundation sponsors projects to make health data more available, including the HealthData+ project, which gives county health departments a platform for telling data-based stories. Although a commercial tool, LiveStories, could handle the story telling component, the system still required dataset that were specific to the wide range of stories its users would write.

The Solution

The California Health Care Foundation hired Civic Knowledge for both its data wrangling services, but also for its expertise in locating the best datasets for any story. Over the course of the 2 year project, we provided hundreds of indicators for the HealthData+ library

Continue Reading →

Analyze Street Sweeping GPS Data

Project Description

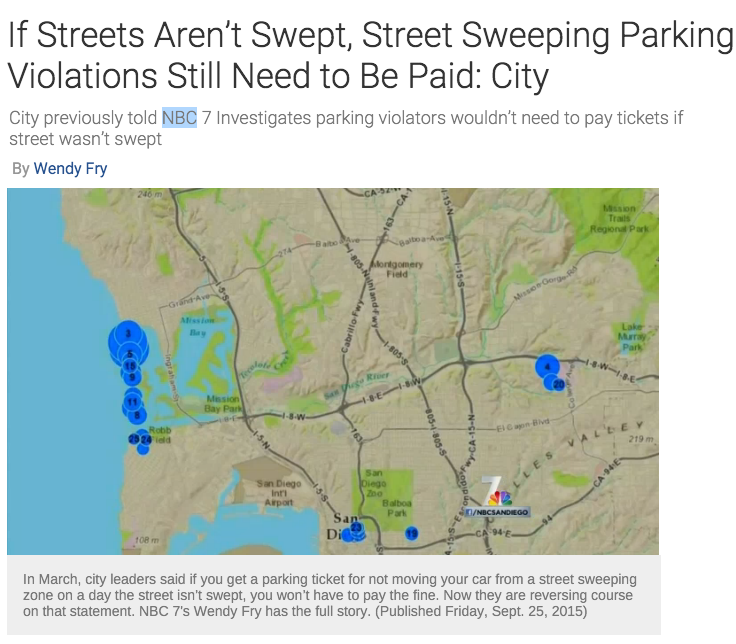
When Wendy Fry, a reporter with NBC 7 San Diego, requested data for a story about street sweeping, the city sent her a dump from their dispatch system’s GPS logs, a dozen files with several million records. Civic Knowledge, working under its nonprofit San Diego Regional Data Library, processed the records to determine which streets had been swept. By merging the reduced data with records of traffic tickets, we determined where residents had been ticketed for parking on a street that was not swept, to support a series of NBC 7 stories and television segments.

Continue Reading →

Test Scores For Economically Disadvantaged Students

The Challenge

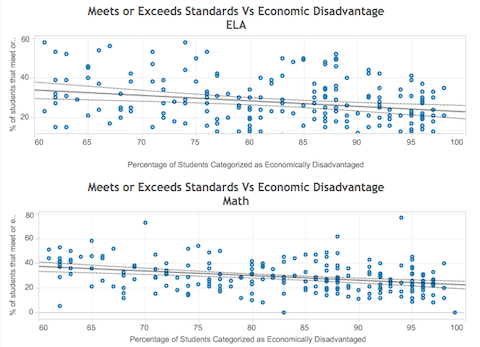
California’s Department of Education provides a rich store of data, and the 2015 California Assessment of Student Performance and Progress were no exception. After the results were released, local educators wanted to know how schools and districts in San Diego county performed, with a special emphasis on high-poverty schools.

The Solution

After loading the 2015 data into our data warehouse, we produced aggregated data files and created a Tableau visualization.

Continue Reading →

Analyze Street Sweeping GPS Data

Project Description

When Wendy Fry, a reporter with NBC 7 San Diego, requested data for a story about street sweeping, the city sent her a dump from their dispatch system’s GPS logs, a dozen files with several million records. Civic Knowledge, working under its nonprofit San Diego Regional Data Library, processed the records to determine which streets had been swept. By merging the reduced data with records of traffic tickets, we determined where residents had been ticketed for parking on a street that was not swept, to support a series of NBC 7 stories and television segments.

Continue Reading →

HMDA Summary Reports

The Challenge

The San Diego Housing Commission reviews data reports from the Home Mortgage Disclosure Act to ensure that San Diego area lenders are following the law. When they wanted to reduce costs of processing the data into summary reports, they turned to Civic Knowledge for help.

 The Solution

Because we had already loaded HMDA data into our data warehouse, we could quickly produce the required reports,  and because all of the work was done using Python and IPython notebook, the reports will be repeatable in future years, for an even lower cost.

Continue Reading →