Crime Rhythm Maps

Eric Busboom.

Exploring crime patterns with Ryhthm Maps, heat maps with two time dimensions.

`` Full notebook on github

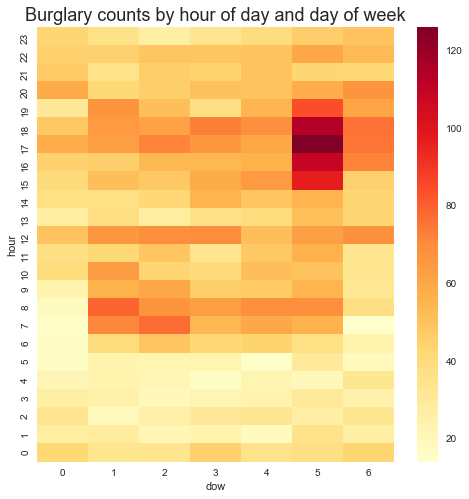
A Rhythm map is a heat map with two time dimensions, which makes it much esier to find temporal patterns in some kinds of data. This example will use crime incidents from San Diego county, from 2007 to 2013..

Plotting the number of incidents for burglary versus the hour of the day, for instance, results in this dull chart:
Continue Reading →

San Diego Police Calls for Service

In preparation for the SCALE and Open San Diego Crime ANalysis Presentation, I downloaded the data package for the presentation and started on the analysis a bit early.

The presentation will use the San Diego Police 2015 calls for service, but the data repository has 2016 and 2017 as well. The seperate files for each of the three years are converted into a data package on our repository, and I also created Metapack packages for the boundary files for beats, neighborhoods and districts. Merging in these boundary files allows for analysing crime counts by geography. Here are the packages:

Continue Reading →

Crime Rhythm Maps

A Rhythm map is a heat map with two time dimensions, which makes it much easier to find temporal patterns in some kinds of data. This example will use crime incidents from San Diego county, from 2007 to 2013..

Plotting the number of incidents for burglary versus the hour of the day, for instance, results in this dull chart:

There are a few interesting patterns here, primarily the minimum at about 5:00AM. But nearly all categories of crime have a lull at 5:00 in the morning, which isn’t very surprising. Part of the reason that the chart isn’t very useful is that there are several types of burglary, and they happen at different times of the week and different times of the day, a distinction which isn’t visible in a line plot. So, let’s look at burglary by hour of day and day of week.

Continue Reading →