The US government has been widely criticized for its failure to test as many of its citizens for COVID-19 infections as other countries. But is mass testing really as easy as it seems? This analysis of the false positive and false negative rates of tests, using published sensitivities and specificities for COVID-19 rt-PCR and antigen tests, shows that even tests with slightly less than perfect results can produce very large numbers of false positives.
Rent During COVID
Richard Florida’s article in the Wall Street Journal documents the early results of worker’s shift from offices to Zoom; falling rents and increasing vacancies in expensive large metros and the opposite trend in smaller less expensive metros, using data provided by Apartment List.
The Apartment List data shows a very broad decline in US rents compared to previous years, starting in with the COVID-19 pandemic in March of 2020. However, the national declines are primarily due to rent drops in expensive coastal cities. More affordable cities, however, have seen significant rent increases:
Los Angeles Homelessness By Land Use
An exploration of the Los Angeles homelessness counts allocated to land use categories. Full notebook on github
The Los Angeles Homeless Services Authority is responsible for conducting the annual Point-In-Time-Count of homeless people in Los Angeles, and publishes the data to their website. The dataqset they publish dataset is re-packaged for easier analysis at the San Diego Regional Data Library’s Data Repository. . This analysis links the Data Library’s data package to LA City tax assessor’s parcels to study estimates of homless populations organized by land use categories.
Tracking City Department Performance
Andy Keatts, a reporter for Voice of San Diego, had been working for months with the City’s Development Services Department to release hundreds of thousands of development permit records, but working with XML data was beyond a reporter’s typical skill set. Civic Knowledge extracted the records from the City’s API and converted the XML records to CSV files. After extracting the data, a Civic Knowledge analyst worked closely with Andy to explore the dataset and find the story, resulting in a series of five stories.
Plotting San Diego Streetlights
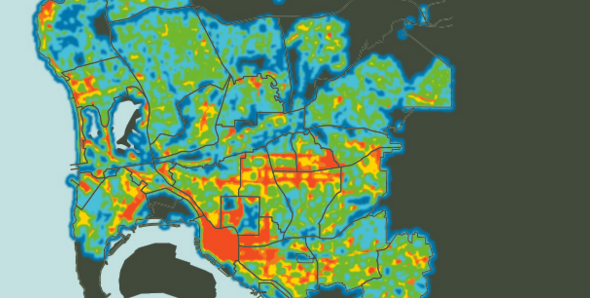
Illustration by Amy Krone using data supplied by Civic Knowledge
The Challenge
After writing a series of stories about San Diego city infrastructure, Voice of San Diego reporter Liam Dillon turned his attention to street lamps. Although the city published GIS data for the locations of street lamps, Liam wanted to understand how the number of lamps varied by community.
The Solution
Working through our non profit project, the San Diego Regional Data Library, we computed small-area areal densities of street lamps and aggregated the densities by San Diego community, allowing Liam to tell a compelling story about where San Diegans are in the dark
Health Data +
The Challenge
As part of it’s “Free The Data” program, the California Health Care Foundation sponsors projects to make health data more available, including the HealthData+ project, which gives county health departments a platform for telling data-based stories. Although a commercial tool, LiveStories, could handle the story telling component, the system still required dataset that were specific to the wide range of stories its users would write.
The Solution
The California Health Care Foundation hired Civic Knowledge for both its data wrangling services, but also for its expertise in locating the best datasets for any story. Over the course of the 2 year project, we provided hundreds of indicators for the HealthData+ library
Analyze Street Sweeping GPS Data
Project Description
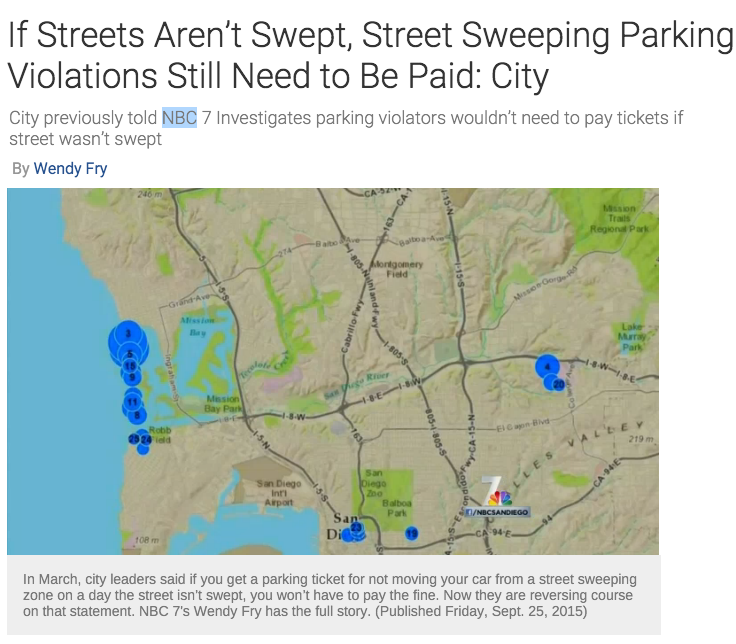
When Wendy Fry, a reporter with NBC 7 San Diego, requested data for a story about street sweeping, the city sent her a dump from their dispatch system’s GPS logs, a dozen files with several million records. Civic Knowledge, working under its nonprofit San Diego Regional Data Library, processed the records to determine which streets had been swept. By merging the reduced data with records of traffic tickets, we determined where residents had been ticketed for parking on a street that was not swept, to support a series of NBC 7 stories and television segments.
Test Scores For Economically Disadvantaged Students
The Challenge
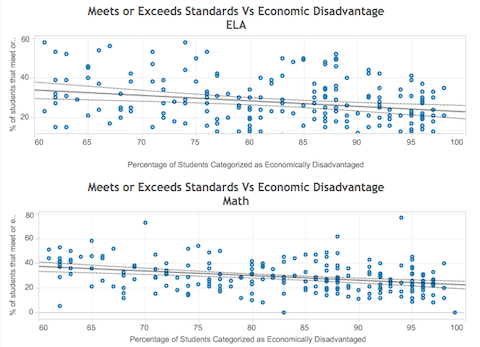
California’s Department of Education provides a rich store of data, and the 2015 California Assessment of Student Performance and Progress were no exception. After the results were released, local educators wanted to know how schools and districts in San Diego county performed, with a special emphasis on high-poverty schools.
The Solution
After loading the 2015 data into our data warehouse, we produced aggregated data files and created a Tableau visualization.
Analyze Street Sweeping GPS Data
Project Description
When Wendy Fry, a reporter with NBC 7 San Diego, requested data for a story about street sweeping, the city sent her a dump from their dispatch system’s GPS logs, a dozen files with several million records. Civic Knowledge, working under its nonprofit San Diego Regional Data Library, processed the records to determine which streets had been swept. By merging the reduced data with records of traffic tickets, we determined where residents had been ticketed for parking on a street that was not swept, to support a series of NBC 7 stories and television segments.
HMDA Summary Reports
The Challenge
The San Diego Housing Commission reviews data reports from the Home Mortgage Disclosure Act to ensure that San Diego area lenders are following the law. When they wanted to reduce costs of processing the data into summary reports, they turned to Civic Knowledge for help.
The Solution
Because we had already loaded HMDA data into our data warehouse, we could quickly produce the required reports, and because all of the work was done using Python and IPython notebook, the reports will be repeatable in future years, for an even lower cost.